Body
Simon MS Success
Plan you future career with Simon.
Simon’s specialized MS programs are designed to prepare you for targeted, high-impact careers in today’s data-driven business world. Our graduates launch into roles across a range of industries, supported by rigorous academics, hands-on learning, and personalized career support.

MS in Finance
- $80,501 mean base salary plus signing bonus for graduates employed in the US (2025)
Many of our MS in Finance graduates choose careers in:
- Corporate Finance
- Investment Management
- Risk Management

MS in Accountancy
- 91% of job-seeking graduates received employment offers within 6 months of graduation (2025)
Many of our MS in Accountancy graduates choose careers in:
- Public Accounting
- Corporate Accounting
- Auditing

MS in Business Analytics
- $75,801 mean base salary plus signing bonus for graduates employed in the US (2025)
Many of our MS in Business Analytics graduates choose careers in:
- Data Analysis
- Consulting
- Product Management
Learn more about our MS in Business Analytics career paths »

MS in Marketing Analytics
- 90% of job-seeking graduates received employment offers within 6 months of graduation (2025)
Many of our MS in Marketing Analytics graduates choose careers in:
- Market Research
- Sales Analytics
- Pricing
Learn more about our MS in Marketing Analytics career paths »
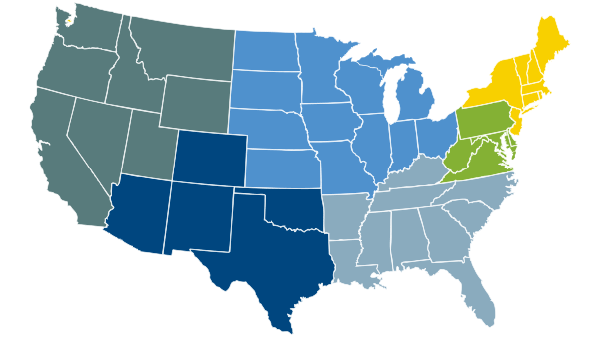
Hiring Regions in the US
- Northeast: 40.9%
- Mid-Atlantic: 4%
- South: 3.6%
- Southwest: 7.6%
- Midwest: 5.8%
- West: 19.1%

Where Our Graduates Go
Calculations for career-related figures adhere to the Career Services
and Employer Alliance’s Standards for Reporting Specialty Master’s Employment Data.
All data is accurate as of April 1, 2026.
- 73% of job-seeking MS graduates received employment offers within 6 months of graduation. (Class of 2025)
- 80.9% of those hired are working in North America (Class of 2025)
- 17.3% of those hired are working in Asia (Class of 2025)
- 0.9% of those hired are working in Europe (Class of 2025)
- 0.9% of those hired are working in Latin America & the Caribbean (Class of 2025)